⚠️ LEARNING PROJECT: This is a personal learning project in the
field of data engineering. I understand the architecture might not be the most optimal as this
project. I made this to practise and learn. Feedback and suggestions are highly welcomed!
Football Statistics Tracker 📊⚽
Python 3.12 GCP Powered IaC Terraform Svelte BigQuery Firestore
An end-to-end data engineering pipeline that collects, processes, and analyzes football match results, standings data, weather data, Reddit data and summarizes matchdays using Gemini from the top 5 European leagues. Used data sources include football-data.org API, Open-Meteo API, and PRAW (Reddit API), Maps...
Introduction
This project demonstrates a complete data pipeline for football (soccer) results, from data extraction to visualization. It implements some data engineering practices including data lakes, transformation layers, and Infrastructure as Code (IaC) with Terraform.
Features
- Automated Data Collection: Scheduled data fetching from multiple APIs using Google Cloud Functions
- Multi-layer Data Architecture: Raw data stored in GCS, processed data in BigQuery, and user-facing data in Firestore
- Weather Integration: Match statistics with weather data at match time
- Social Media (Reddit) Data: Reddit comments for fan sentiment
- Infrastructure as Code: Cloud Functions and Pub/Sub subscriptions and topics defined and deployed with Terraform
Architecture
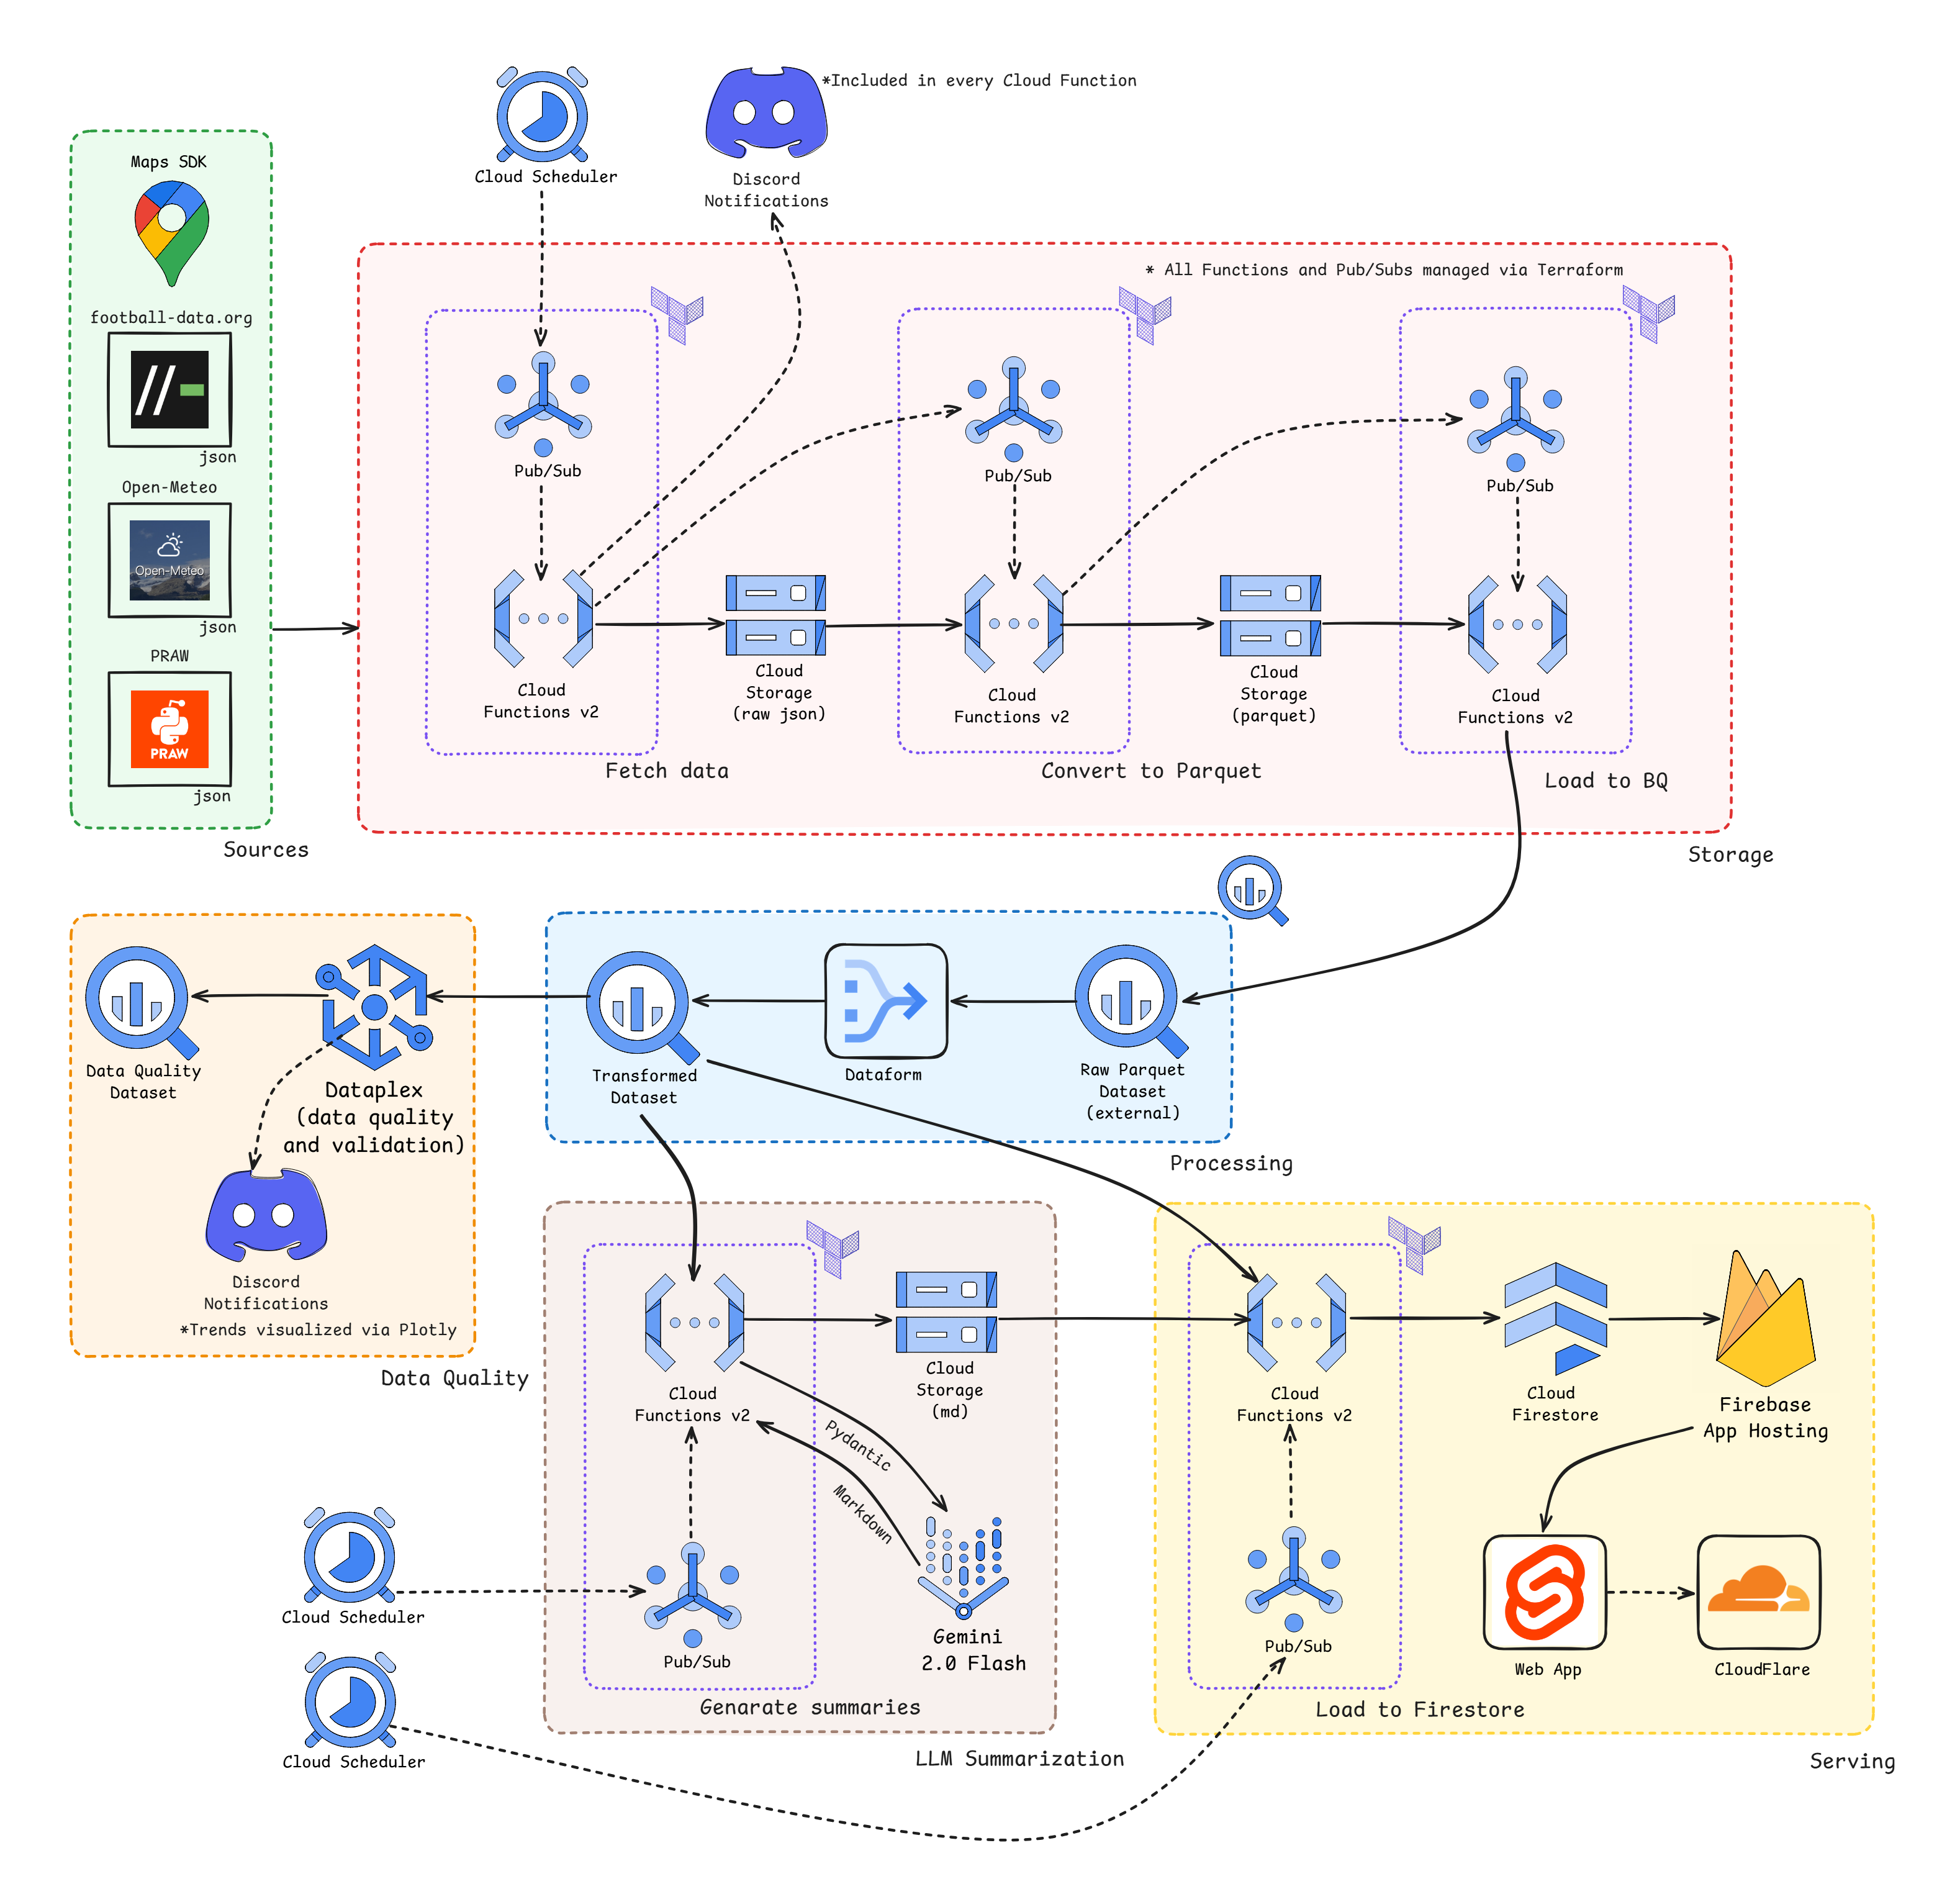
The pipeline follows the following architecture:
- Data Ingestion: Cloud Functions trigger on schedule to fetch data
- Storage Layers: Raw data(json) → External BQ tables (Parquet) → Processed Data in BQ → Firestore
- Validation: Very simple validation and Data quality with Dataplex
- Summarization: Creation of short summaries in Markdown with Gemini 2.0 Flash
- Visualization: This web app for insights
Data Sources
- Football-data.org: Match data, team data, and standings
- Open-Meteo API: Historical weather data
- Reddit (via PRAW): Fan comments and sentiment
- Maps SDK: Location of stadiums
Technology Stack
| Category | Technologies |
|---|---|
| Cloud Platform | Google Cloud Platform (GCP) |
| Infrastructure as Code | Terraform |
| Programming Languages | Python, TypeScript (Svelte) |
| Data Storage | Cloud Storage, BigQuery, Firestore |
| Data Quality | Dataplex |
| Data Transformation | Dataform |
| Serverless Computing | Cloud Functions |
| Event-Driven Architecture | Pub/Sub |
| API Consumption | Football-data.org, Open-Meteo, Reddit API, Google Maps |
| CI/CD | GitHub Actions |
| Package Management | uv, pyproject.toml |
| Code Quality | Ruff, Bandit, Mypy |
| Testing | pytest |
| Web Framework | Svelte, ShadCN UI Components |
| Hosting | Firebase App Hosting |
| LLM | Google Gemini 2.0 Flash |
⚠️ DISCLAIMER: I know this data probably does not have much real
value as it is not real-time and the statistics are not that deep ( I wanted to stay within free
tiers of APIs).
I got the idea to make this project from this repo by digitalghost-dev